Lead Lift Management System: B2B analytics platform for multifamily advertising ROI
UX Designer
Helping property managers see which advertising investments were working.
Apartment Finder's multifamily advertisers needed to understand which listings, lead sources, and lease conversions were producing results. I designed a lead management system that made advertising performance searchable, comparable, and easier to act on.
The user wasn't a renter browsing listings. It was a property manager trying to justify a six-figure advertising budget to their regional director.
An internal analytics platform that gave B2B advertisers clear visibility into lead performance and ROI.
Translated raw lead data into structured, searchable, filterable reporting — enabling property managers to evaluate advertising effectiveness, compare lead sources, and make data-informed budget decisions.
Built for property managers and multifamily advertisers evaluating ROI on listing investments.
Apartment Finder's monthly traffic volume meant substantial lead data flowing through the system continuously.
Property management companies and landlords paying listing fees and referral commissions — the platform's revenue engine.
Lead volume, prospect and lease conversion rate, cost per lease (CPL), and source attribution.
The user was not a renter browsing listings. The user was a property manager trying to justify advertising spend.
Lead volume showed activity, but cost per lease showed whether the investment was working. Property managers needed to answer a simple sequence: Where are leads coming from? Which leads are converting? What does each lease cost? Which sources are worth continued investment?
The design followed the advertising decision, not the data structure. This was not a reporting tool. It was a budget decision tool.
Designed for a business user who measures everything but has time for nothing.
Property managers and regional directors have deep domain expertise and limited time. The information architecture followed the decision sequence: lead volume first → conversion quality second → cost efficiency third. Columns organized as: source, leads, prospects, tours, leases, CPL — in the order a property manager actually evaluates performance.
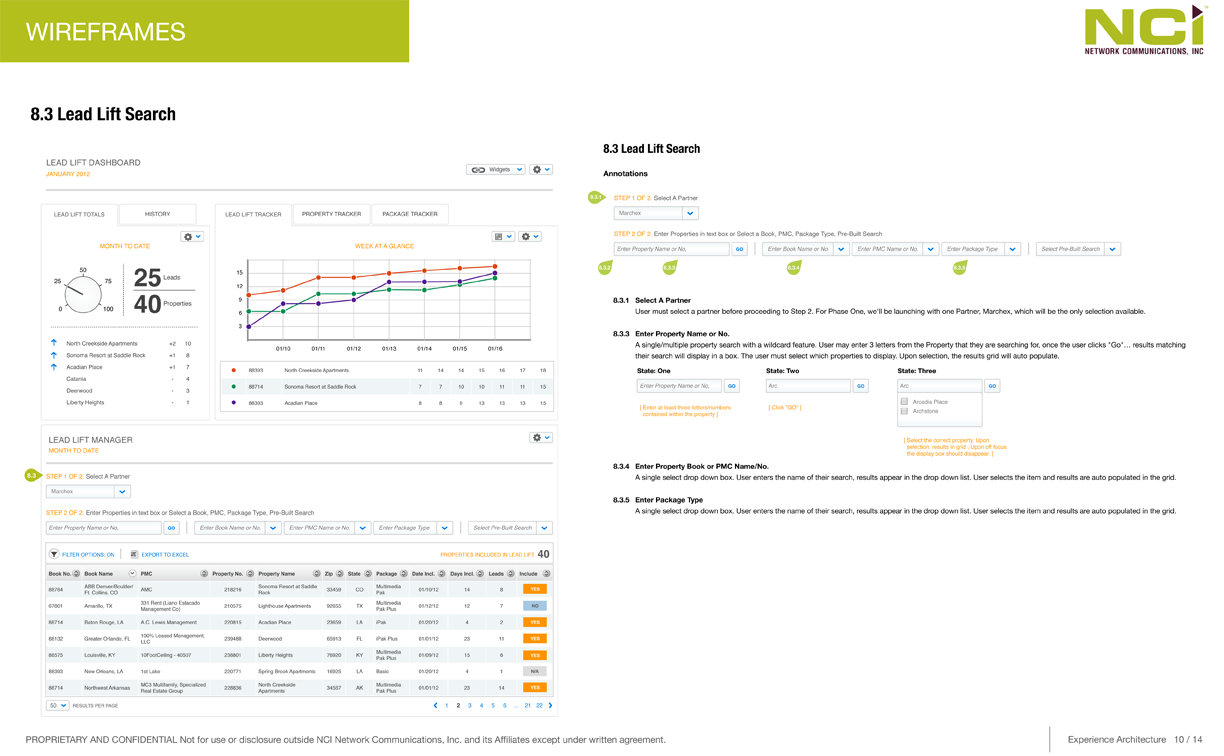
Search as primary entry point
Users always knew what they were looking for. Progressive filtering narrowed the dataset before applying the next filter — reducing cognitive load on complex lead data.
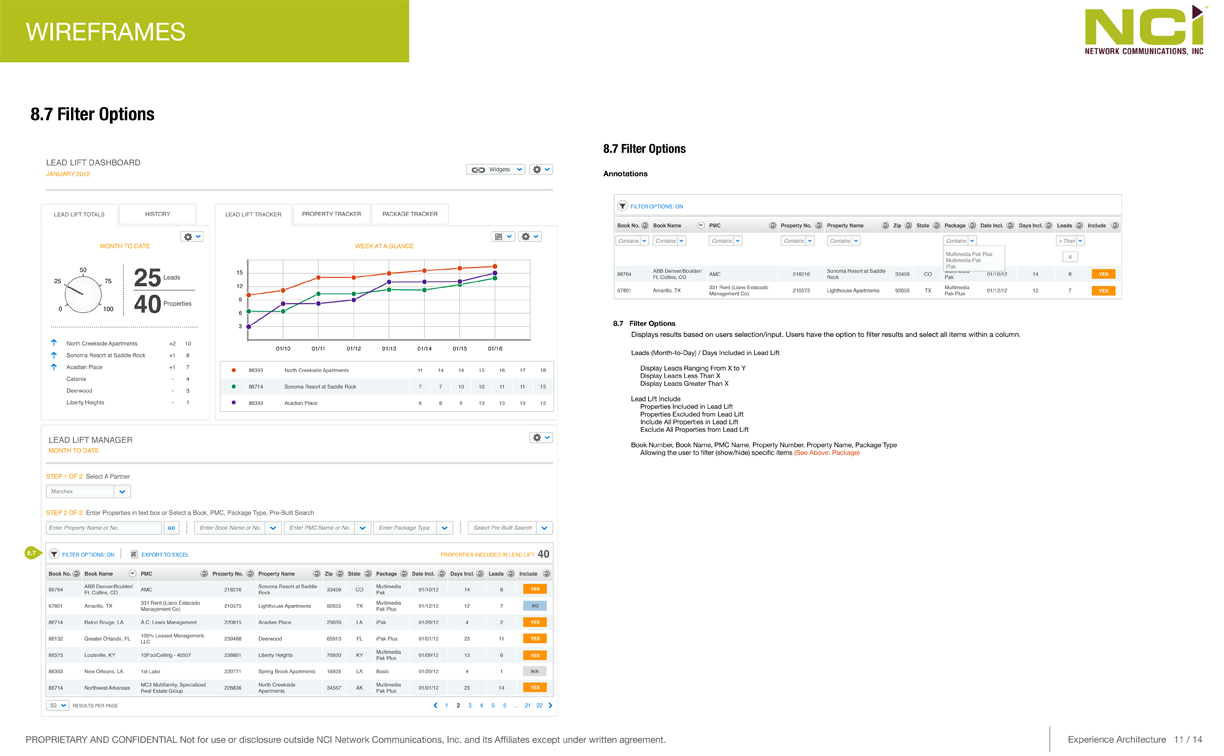
Plain-language metrics
Labels used property manager vocabulary, not database field names. CPL surfaced directly — pre-calculated, not derived manually by the user.
Five screens. One decision flow.
Each screen was designed around a specific decision moment — reducing the steps between landing on the tool and finding an actionable answer.
Home Dashboard
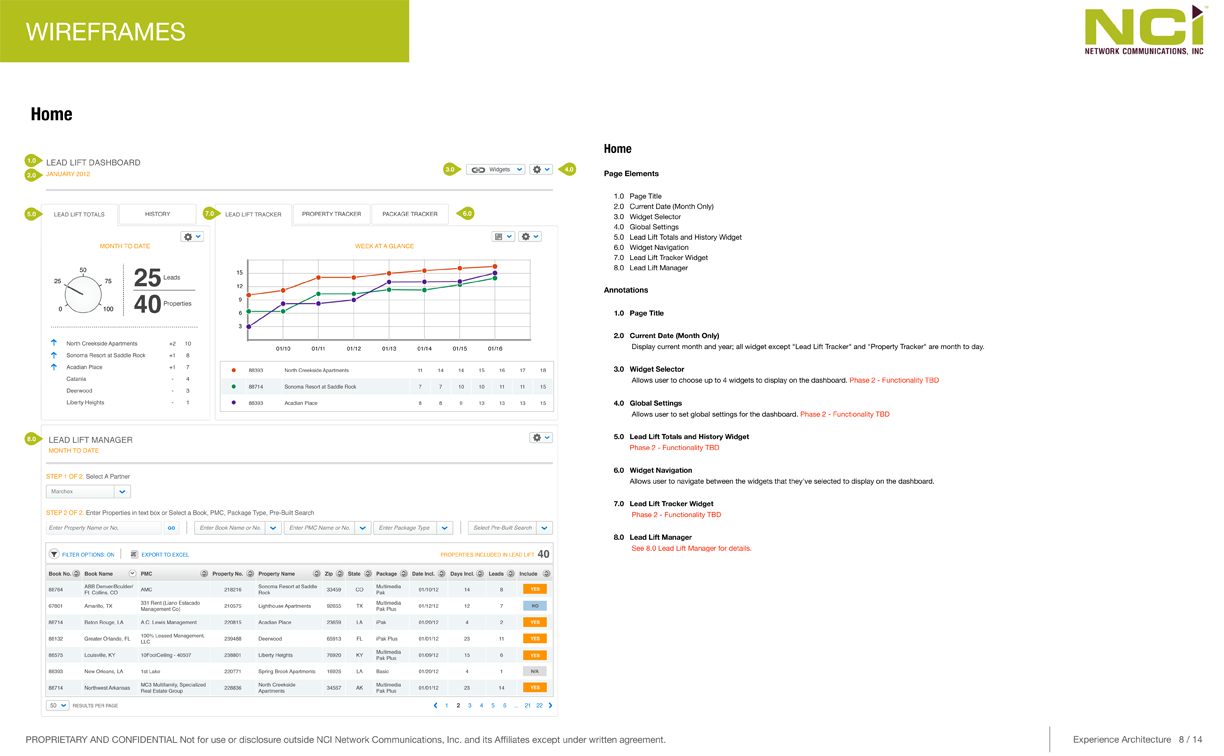
The home dashboard answered "how am I doing?" immediately — lead volume, conversion rate, and cost-per-lease surfaced without any navigation required.
Supporting workflow screens
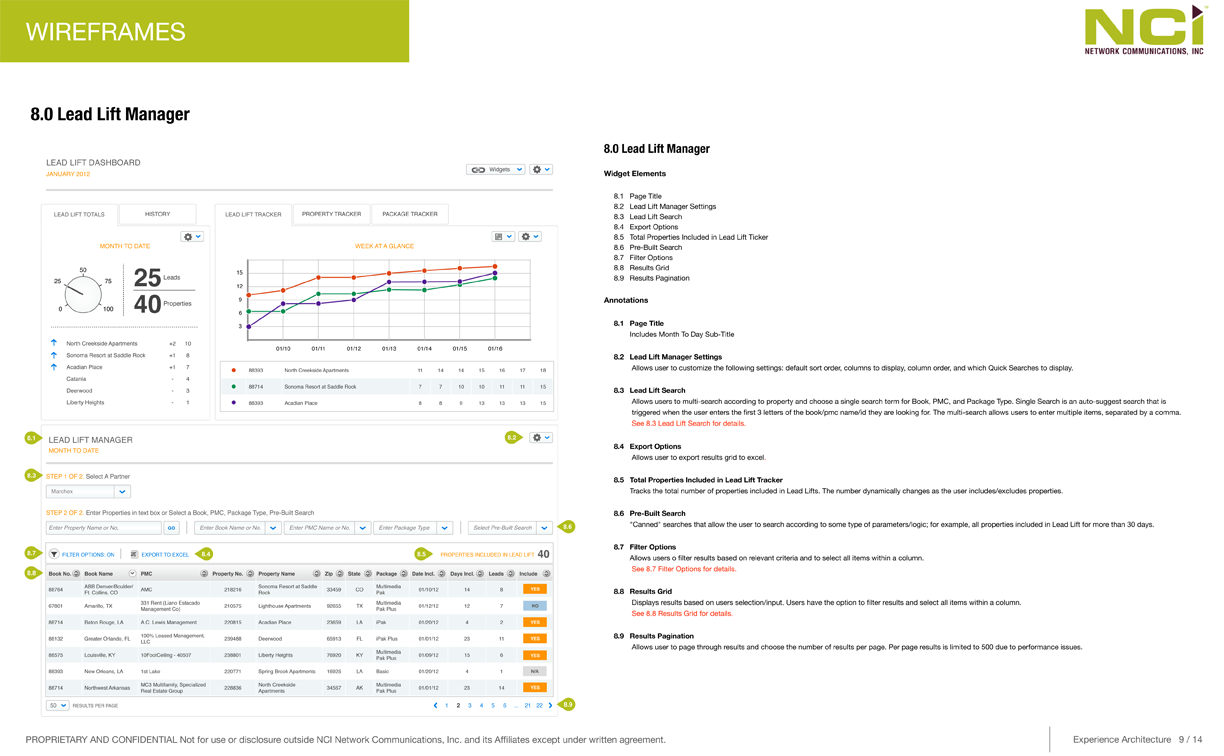
Results Grid
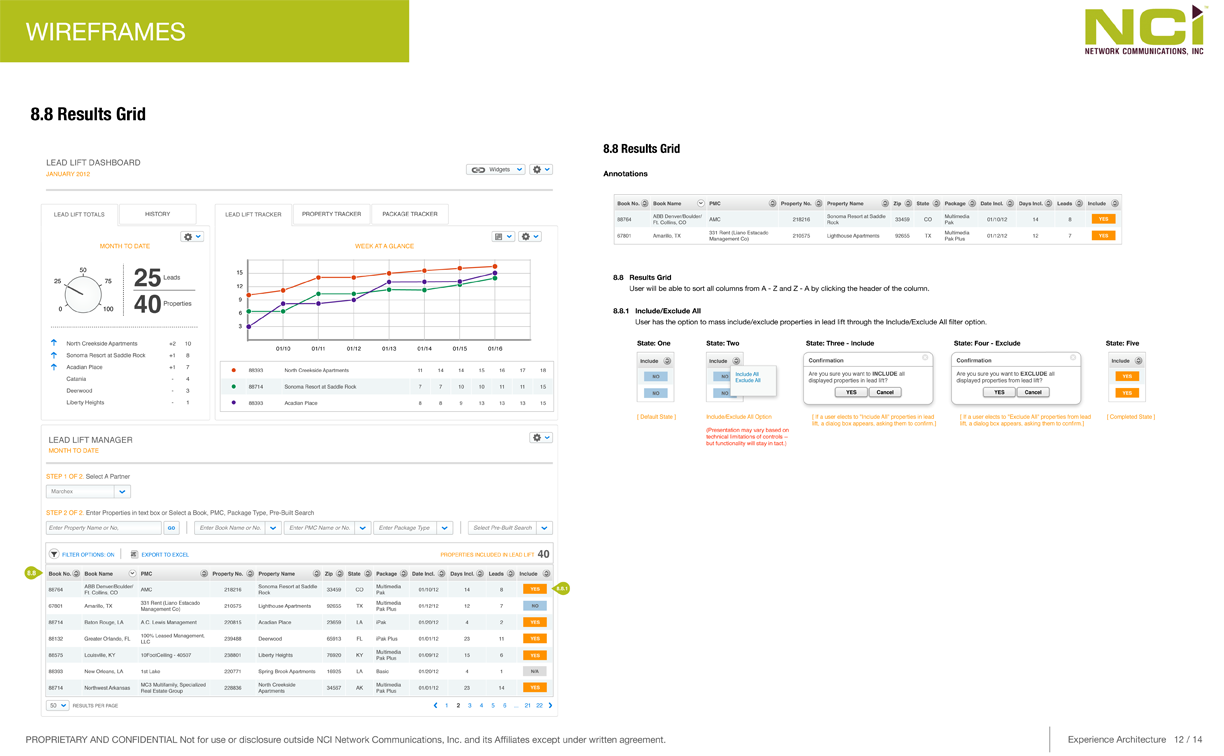
Results grid — sortable, scannable lead performance organized in decision order: source, leads generated, prospects, tours, signed leases, and cost per lease.
What This Shaped
The tool shifted lead reporting from raw activity tracking to advertising ROI analysis — giving property managers and regional leaders a shared way to compare performance across lead sources and properties.
For Apartment Finder, advertiser value depended on showing that listing spend could produce measurable results. Lead Lift gave property managers a clearer way to evaluate that value and make more confident budget decisions.